Trace 查看器
简介
Playwright 追踪查看器是一个 GUI 工具,可以帮助你在脚本运行后探索已记录的 Playwright 追踪。当你的测试在 CI 上失败时,追踪是调试测试的好方法。你可以本地打开追踪,也可以在浏览器中访问 trace.playwright.dev 打开。
打开追踪查看器
你可以使用 Playwright CLI 或在浏览器中访问 trace.playwright.dev 打开保存的追踪。请确保添加 trace.zip 文件所在的完整路径。
pwsh bin/Debug/netX/playwright.ps1 show-trace trace.zip
使用 trace.playwright.dev
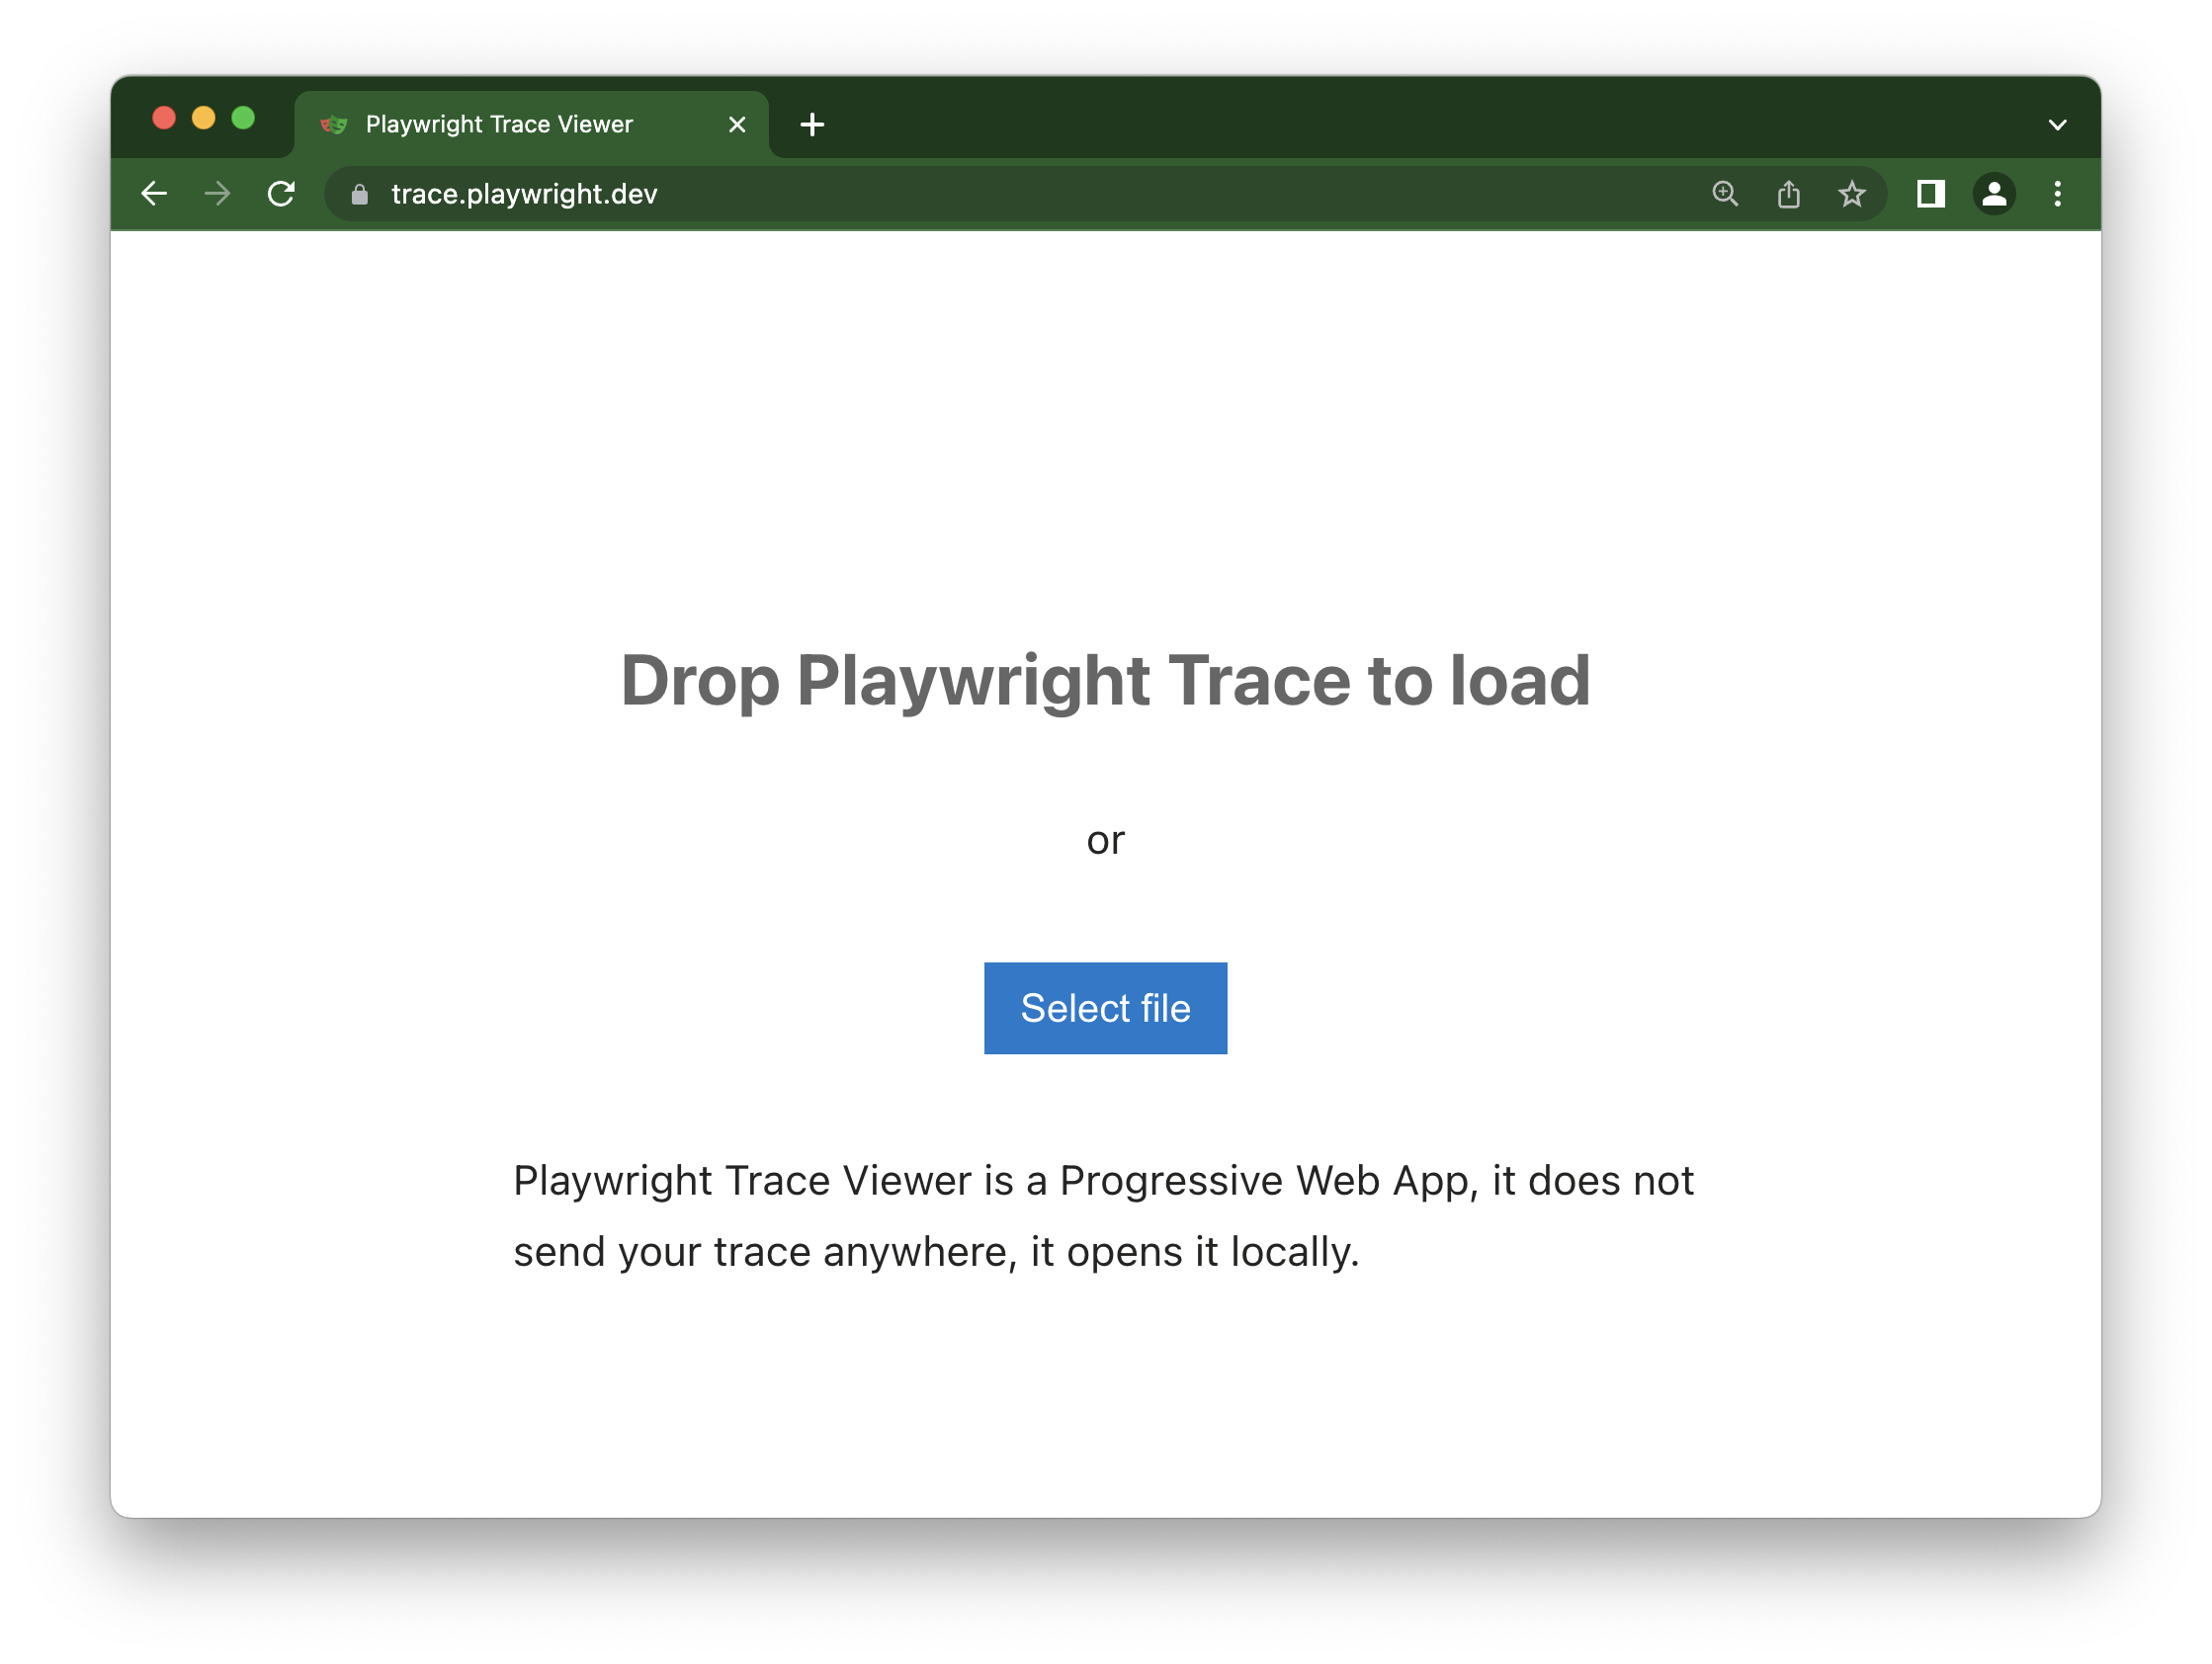
trace.playwright.dev 是追踪查看器的一个静态托管版本。您可以使用拖放或通过 选择文件 按钮上传追踪文件。
追踪查看器完全在您的浏览器中加载追踪,不会向外部传输任何数据。
查看远程追踪
您可以直接使用其 URL 打开远程追踪。这使得查看远程追踪变得容易,例如,无需手动从 CI 运行中下载文件。
pwsh bin/Debug/netX/playwright.ps1 show-trace https://example.com/trace.zip
使用 trace.playwright.dev 时,你还可以将上传的追踪的 URL 作为查询参数传递给某个可访问的存储(例如,在你的 CI 内部)。CORS(跨域资源共享)规则可能适用。
https://trace.playwright.dev/?trace=https://demo.playwright.dev/reports/todomvc/data/fa874b0d59cdedec675521c21124e93161d66533.zip
记录追踪
可以使用 BrowserContext.Tracing API 记录追踪,如下所示
- MSTest
- NUnit
- xUnit
- xUnit v3
namespace PlaywrightTests;

[Parallelizable(ParallelScope.Self)]
[TestFixture]
public class Tests : PageTest
{
    [SetUp]
    public async Task Setup()
    {
        await Context.Tracing.StartAsync(new()
        {
            Title = TestContext.CurrentContext.Test.ClassName + "." + TestContext.CurrentContext.Test.Name,
            Screenshots = true,
            Snapshots = true,
            Sources = true
        });
    }

    [TearDown]
    public async Task TearDown()
    {
        // This will produce e.g.:
        // bin/Debug/net8.0/playwright-traces/PlaywrightTests.Tests.Test1.zip
        await Context.Tracing.StopAsync(new()
        {
            Path = Path.Combine(
                TestContext.CurrentContext.WorkDirectory,
                "playwright-traces",
                $"{TestContext.CurrentContext.Test.ClassName}.{TestContext.CurrentContext.Test.Name}.zip"
            )
        });
    }

    [Test]
    public async Task TestYourOnlineShop()
    {
        // ..
    }
}
using System.Text.RegularExpressions;
using Microsoft.Playwright;
using Microsoft.Playwright.MSTest;

namespace PlaywrightTestsMSTest;

[TestClass]
public class UnitTest1 : PageTest
{
    [TestInitialize]
    public async Task TestInitialize()
    {
         await Context.Tracing.StartAsync(new()
        {
            Title = TestContext.TestName,
            Screenshots = true,
            Snapshots = true,
            Sources = true
        });
    }

    [TestCleanup]
    public async Task TestCleanup()
    {
        // This will produce e.g.:
        // bin/Debug/net8.0/playwright-traces/PlaywrightTests.UnitTest1.zip
        await Context.Tracing.StopAsync(new()
        {
            Path = Path.Combine(
                Environment.CurrentDirectory,
                "playwright-traces",
                $"{TestContext.FullyQualifiedTestClassName}.zip"
            )
        });
    }

    [TestMethod]
    public async Task TestYourOnlineShop()
    {
        // ...
    }
}
using System.Reflection;
using Microsoft.Playwright;
using Microsoft.Playwright.Xunit;
using Xunit.Sdk;

namespace PlaywrightTests;

[WithTestName]
public class UnitTest1 : PageTest
{
    public override async Task InitializeAsync()
    {
        await base.InitializeAsync().ConfigureAwait(false);
        await Context.Tracing.StartAsync(new()
        {
            Title = $"{WithTestNameAttribute.CurrentClassName}.{WithTestNameAttribute.CurrentTestName}",
            Screenshots = true,
            Snapshots = true,
            Sources = true
        });
    }

    public override async Task DisposeAsync()
    {
        await Context.Tracing.StopAsync(new()
        {
            Path = Path.Combine(
                Environment.CurrentDirectory,
                "playwright-traces",
               $"{WithTestNameAttribute.CurrentClassName}.{WithTestNameAttribute.CurrentTestName}.zip"
            )
        });
        await base.DisposeAsync().ConfigureAwait(false);
    }

    [Fact]
    public async Task GetStartedLink()
    {
        // ...
        await Page.GotoAsync("https://playwright.net.cn/dotnet/docs/intro");
    }
}

public class WithTestNameAttribute : BeforeAfterTestAttribute
{
    public static string CurrentTestName = string.Empty;
    public static string CurrentClassName = string.Empty;

    public override void Before(MethodInfo methodInfo)
    {
        CurrentTestName = methodInfo.Name;
        CurrentClassName = methodInfo.DeclaringType!.Name;
    }

    public override void After(MethodInfo methodInfo)
    {
    }
}
using System.Reflection;
using Microsoft.Playwright;
using Microsoft.Playwright.Xunit.v3;
using Xunit.Sdk;

namespace PlaywrightTests;

[WithTestName]
public class UnitTest1 : PageTest
{
    public override async Task InitializeAsync()
    {
        await base.InitializeAsync().ConfigureAwait(false);
        await Context.Tracing.StartAsync(new()
        {
            Title = $"{WithTestNameAttribute.CurrentClassName}.{WithTestNameAttribute.CurrentTestName}",
            Screenshots = true,
            Snapshots = true,
            Sources = true
        });
    }

    public override async Task DisposeAsync()
    {
        await Context.Tracing.StopAsync(new()
        {
            Path = Path.Combine(
                Environment.CurrentDirectory,
                "playwright-traces",
               $"{WithTestNameAttribute.CurrentClassName}.{WithTestNameAttribute.CurrentTestName}.zip"
            )
        });
        await base.DisposeAsync().ConfigureAwait(false);
    }

    [Fact]
    public async Task GetStartedLink()
    {
        // ...
        await Page.GotoAsync("https://playwright.net.cn/dotnet/docs/intro");
    }
}

public class WithTestNameAttribute : BeforeAfterTestAttribute
{
    public static string CurrentTestName = string.Empty;
    public static string CurrentClassName = string.Empty;

    public override void Before(MethodInfo methodInfo)
    {
        CurrentTestName = methodInfo.Name;
        CurrentClassName = methodInfo.DeclaringType!.Name;
    }

    public override void After(MethodInfo methodInfo)
    {
    }
}
这将记录追踪并将其放置在 bin/Debug/net8.0/playwright-traces/ 目录中。
仅在失败时运行追踪
设置你的测试,使其仅在测试失败时记录追踪
- MSTest
- NUnit
- xUnit
- xUnit v3
namespace PlaywrightTests;

[Parallelizable(ParallelScope.Self)]
[TestFixture]
public class ExampleTest : PageTest
{
    [SetUp]
    public async Task Setup()
    {
        await Context.Tracing.StartAsync(new()
        {
            Title = $"{TestContext.CurrentContext.Test.ClassName}.{TestContext.CurrentContext.Test.Name}",
            Screenshots = true,
            Snapshots = true,
            Sources = true
        });
    }

    [TearDown]
    public async Task TearDown()
    {
        var failed = TestContext.CurrentContext.Result.Outcome == NUnit.Framework.Interfaces.ResultState.Error
            || TestContext.CurrentContext.Result.Outcome == NUnit.Framework.Interfaces.ResultState.Failure;

        await Context.Tracing.StopAsync(new()
        {
            Path = failed ? Path.Combine(
                TestContext.CurrentContext.WorkDirectory,
                "playwright-traces",
                $"{TestContext.CurrentContext.Test.ClassName}.{TestContext.CurrentContext.Test.Name}.zip"
            ) : null,
        });
    }

    [Test]
    public async Task GetStartedLink()
    {
        // ..
    }
}
using System.Text.RegularExpressions;
using Microsoft.Playwright;
using Microsoft.Playwright.MSTest;

namespace PlaywrightTests;

[TestClass]
public class ExampleTest : PageTest
{
    [TestInitialize]
    public async Task TestInitialize()
    {
         await Context.Tracing.StartAsync(new()
        {
            Title = $"{TestContext.FullyQualifiedTestClassName}.{TestContext.TestName}",
            Screenshots = true,
            Snapshots = true,
            Sources = true
        });
    }

    [TestCleanup]
    public async Task TestCleanup()
    {
        var failed = new[] { UnitTestOutcome.Failed, UnitTestOutcome.Error, UnitTestOutcome.Timeout, UnitTestOutcome.Aborted }.Contains(TestContext.CurrentTestOutcome);

        await Context.Tracing.StopAsync(new()
        {
            Path = failed ? Path.Combine(
                Environment.CurrentDirectory,
                "playwright-traces",
                $"{TestContext.FullyQualifiedTestClassName}.{TestContext.TestName}.zip"
            ) : null,
        });
    }

    [TestMethod]
    public async Task GetStartedLink()
    {
        // ...
    }
}
using System.Reflection;
using Microsoft.Playwright;
using Microsoft.Playwright.Xunit;
using Xunit.Sdk;

namespace PlaywrightTests;

[WithTestName]
public class UnitTest1 : PageTest
{
    public override async Task InitializeAsync()
    {
        await base.InitializeAsync().ConfigureAwait(false);
        await Context.Tracing.StartAsync(new()
        {
            Title = $"{WithTestNameAttribute.CurrentClassName}.{WithTestNameAttribute.CurrentTestName}",
            Screenshots = true,
            Snapshots = true,
            Sources = true
        });
    }

    public override async Task DisposeAsync()
    {
        await Context.Tracing.StopAsync(new()
        {
            Path = !TestOk ? Path.Combine(
                Environment.CurrentDirectory,
                "playwright-traces",
               $"{WithTestNameAttribute.CurrentClassName}.{WithTestNameAttribute.CurrentTestName}.zip"
            ) : null
        });
        await base.DisposeAsync().ConfigureAwait(false);
    }

    [Fact]
    public async Task GetStartedLink()
    {
        // ...
        await Page.GotoAsync("https://playwright.net.cn/dotnet/docs/intro");
    }
}

public class WithTestNameAttribute : BeforeAfterTestAttribute
{
    public static string CurrentTestName = string.Empty;
    public static string CurrentClassName = string.Empty;

    public override void Before(MethodInfo methodInfo)
    {
        CurrentTestName = methodInfo.Name;
        CurrentClassName = methodInfo.DeclaringType!.Name;
    }

    public override void After(MethodInfo methodInfo)
    {
    }
}
using System.Reflection;
using Microsoft.Playwright;
using Microsoft.Playwright.Xunit.v3;
using Xunit.Sdk;

namespace PlaywrightTests;

[WithTestName]
public class UnitTest1 : PageTest
{
    public override async Task InitializeAsync()
    {
        await base.InitializeAsync().ConfigureAwait(false);
        await Context.Tracing.StartAsync(new()
        {
            Title = $"{WithTestNameAttribute.CurrentClassName}.{WithTestNameAttribute.CurrentTestName}",
            Screenshots = true,
            Snapshots = true,
            Sources = true
        });
    }

    public override async Task DisposeAsync()
    {
        await Context.Tracing.StopAsync(new()
        {
            Path = !TestOk ? Path.Combine(
                Environment.CurrentDirectory,
                "playwright-traces",
               $"{WithTestNameAttribute.CurrentClassName}.{WithTestNameAttribute.CurrentTestName}.zip"
            ) : null
        });
        await base.DisposeAsync().ConfigureAwait(false);
    }

    [Fact]
    public async Task GetStartedLink()
    {
        // ...
        await Page.GotoAsync("https://playwright.net.cn/dotnet/docs/intro");
    }
}

public class WithTestNameAttribute : BeforeAfterTestAttribute
{
    public static string CurrentTestName = string.Empty;
    public static string CurrentClassName = string.Empty;

    public override void Before(MethodInfo methodInfo)
    {
        CurrentTestName = methodInfo.Name;
        CurrentClassName = methodInfo.DeclaringType!.Name;
    }

    public override void After(MethodInfo methodInfo)
    {
    }
}
追踪查看器功能
操作
在“操作”选项卡中,你可以看到每个操作使用了哪个定位器,以及每个操作运行了多长时间。将鼠标悬停在测试的每个操作上,并直观地看到 DOM 快照的变化。在时间轴上前后移动,点击某个操作以进行检查和调试。使用“之前”和“之后”选项卡可以直观地查看操作前后发生的情况。
选择每个操作将显示
- 操作快照
- 操作日志
- 源代码位置
截图
当追踪启用了 屏幕截图 选项(默认)时,每个追踪都会记录一个截屏并将其渲染为电影胶片。你可以将鼠标悬停在电影胶片上,查看每个操作和状态的放大图像,这有助于你轻松找到要检查的操作。
双击某个操作以查看该操作的时间范围。你可以使用时间轴中的滑块增加选定的操作,这些操作将显示在“操作”选项卡中,所有控制台日志和网络日志都将过滤为仅显示选定操作的日志。
快照
当追踪启用了 快照 选项(默认)时,Playwright 会为每个操作捕获一组完整的 DOM 快照。根据操作类型,它将捕获
| 类型 | 描述 |
|---|---|
| 之前 | 在调用操作时的快照。 |
| 操作 | 执行输入时的快照。这种类型的快照在探究 Playwright 究竟点击了哪里时特别有用。 |
| 之后 | 操作后的快照。 |
这是典型的动作快照:
请注意,它同时突出显示了 DOM 节点和精确的点击位置。
源代码
当您点击侧边栏中的一个操作时,该操作的代码行会在源面板中高亮显示。
调用
“调用”选项卡显示有关操作的信息,例如它花费的时间、使用的定位符、是否处于严格模式以及使用的键。
日志
查看测试的完整日志,以更好地了解 Playwright 在幕后正在做什么,例如滚动到视图中、等待元素可见、启用和稳定,以及执行点击、填充、按下等操作。
错误
如果您的测试失败,您将在“错误”选项卡中看到每个测试的错误消息。时间线还将显示一条红线,突出显示错误发生的位置。您还可以单击“源”选项卡以查看错误在源代码的哪一行。
控制台
查看来自浏览器以及测试的控制台日志。显示不同的图标以显示控制台日志是来自浏览器还是来自测试文件。
双击操作侧边栏中测试中的一个操作。这将过滤控制台,仅显示在该操作期间生成的日志。单击显示全部按钮可再次查看所有控制台日志。
使用时间轴通过点击起点并拖动到终点来过滤操作。控制台选项卡也将被过滤,仅显示在选定操作期间生成的日志。
网络
“网络”选项卡显示了测试期间发出的所有网络请求。你可以按不同类型的请求、状态码、方法、请求、内容类型、持续时间和大小进行排序。单击某个请求以查看有关它的更多信息,例如请求头、响应头、请求体和响应体。
双击操作侧边栏中测试中的一个操作。这将过滤网络请求,仅显示在该操作期间发出的请求。单击显示全部按钮可再次查看所有网络请求。
使用时间轴通过点击起点并拖动到终点来过滤操作。网络选项卡也将被过滤,仅显示在选定操作期间发出的网络请求。
元数据
在“操作”选项卡旁边,您会找到“元数据”选项卡,其中会显示有关测试的更多信息,例如浏览器、视口大小、测试持续时间等。